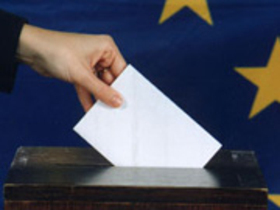
European elections

- (Photo: Notat)
EUROPEAN ELECTIONS
Every five years there are direct elections to the European Parliament in all member states. European elections were held between 4-7 June, 2009 and between 22-25 May 2014.
2014 election results by political group
| Icon | Name | Percentage |
 |
EPP
Group of the European People's Party (Christian Democrats)
|
Result:221 MEPs
Result as percentage:29.43 % |
 |
S&D
Group of the Progressive Alliance of Socialists and Democrats in the European Parliament
|
Result:191 MEPs
Result as percentage:25.43 % |
 |
ECR
European Conservatives and Reformists
|
Result:70 MEPs
Result as percentage:9.32 % |
 |
ALDE
Alliance of Liberals and Democrats for Europe
|
Result:67 MEPs
Result as percentage:8.92 % |
 |
GUE/NGL
European United Left/Nordic Green Left
|
Result:52 MEPs
Result as percentage:6.92 % |
 |
Greens/EFA
The Greens/European Free Alliance
|
Result:50 MEPs
Result as percentage:6.66 % |
 |
EFDD
Europe of freedom and direct democracy Group
|
Result:48 MEPs
Result as percentage:6.39 % |
 |
NI
Non-attached Members – Members not belonging to any political group
|
Result:52 MEPs
Result as percentage:6.92 % |
Notes
- The turnout in the EU as a whole fell from 63% in 1979 to 49% in 1999, 46% in 2004 and 43% in 2009 and 42.54% in 2014. See under Turnout


